Homebuilder
Lender
The Data Gap That's Hiding in Plain Sight
Unlock Loan Data to get Deep Data on your Competition

Don’t risk million-dollar land bets based on census data that's three years old. You're pricing communities against competitors you can barely see. How do you:
Know what product to build: floor plans, square footage, and price point?
Know what incentives to offer to entice buyers and boost sales velocity?
Have the confidence to pull the trigger on land deals that aren’t pencilling?
There's a public dataset that has been sitting in plain sight for decades that answers most of these questions, and almost no one in homebuilding is using it.
Now it's time to change that.
What Locate Alpha Has Done
We partnered with mortgage analytics powerhouse Recursion, which supplied additional loan details that can be visualized on the map in addition to Locate Alpha data.
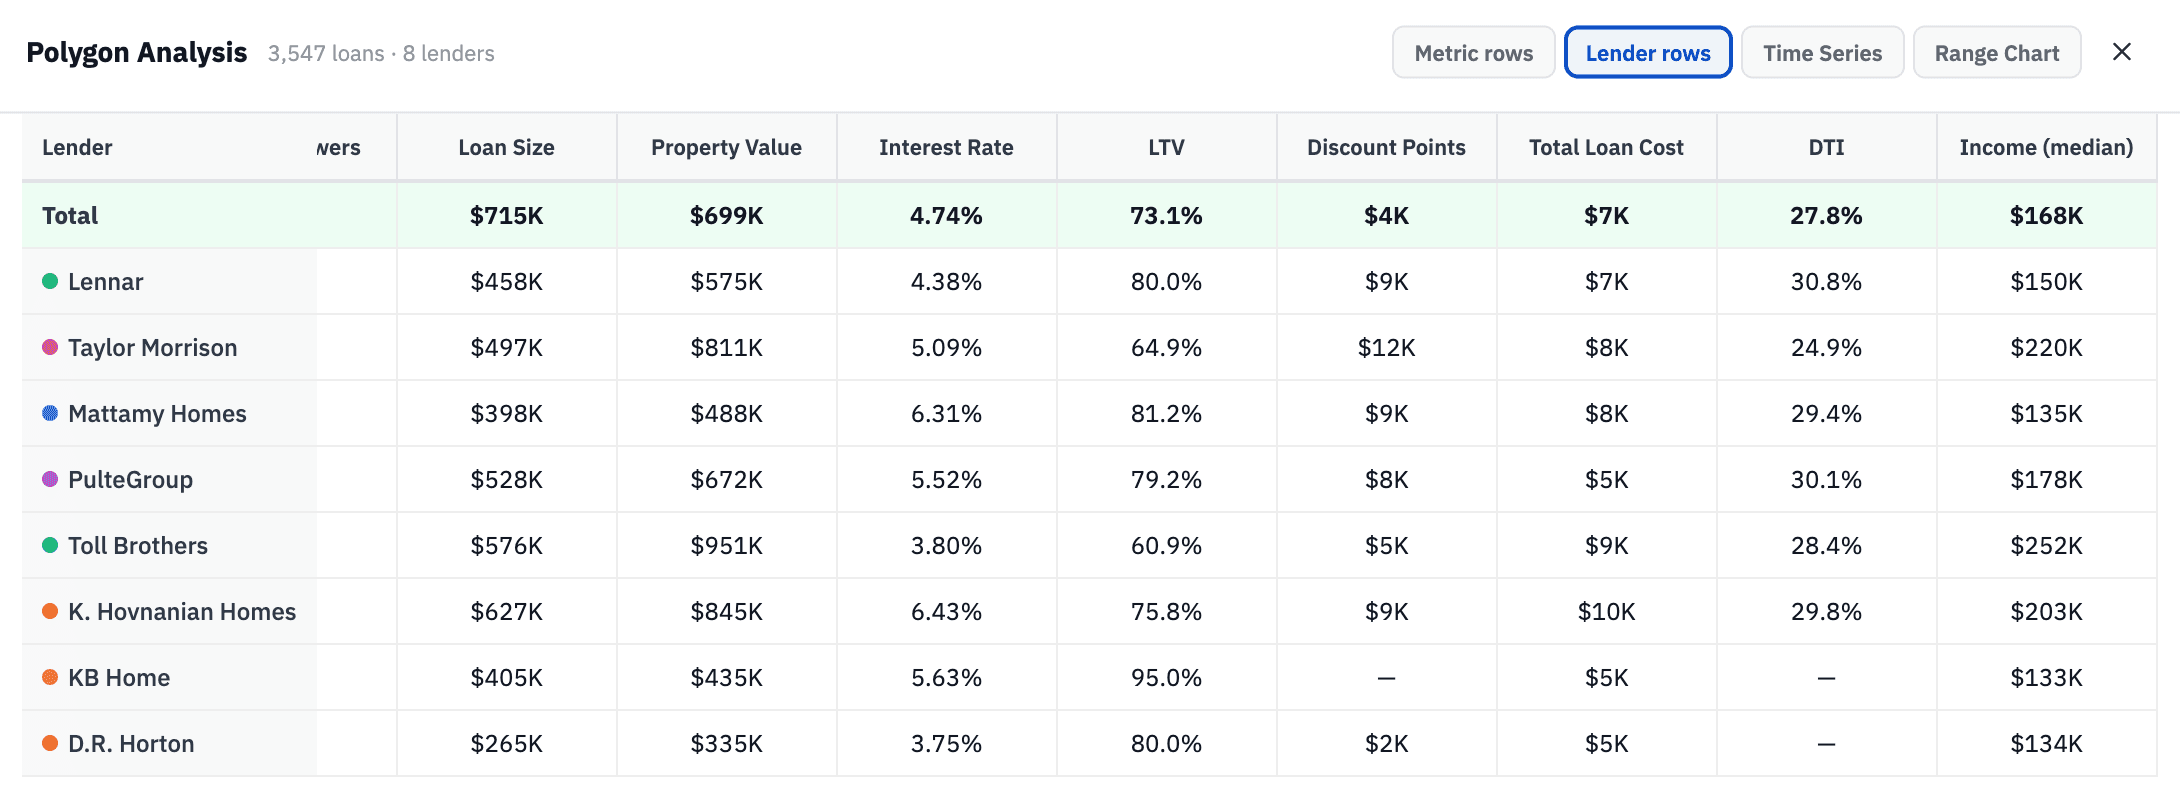
What you get is a user-friendly map layer where you can lasso a few competing communities and see the stats by lender: what the homes sold for, what rates the buyers got, what they declared as income, what the debt-to-income ratio (DTI) was, and what rate buy-downs were included.
Here's why that matters for homebuilders:
Six Reasons Homebuilders Should Care
1. See the terms your competitor next door is actually offering. Builders run rate buy-downs and incentive programs constantly, but the data is elusive. We capture discount points on the loan so that you can see the effective rate a competing builder's buyers received. Combined with the sale price, you can back into a clear picture of what deal was actually struck: list price, buy-down cost, and net terms. That's competitive intelligence that doesn't exist in any other dataset.
2. Better buyer income data than Census. Census-derived median household income figures are notoriously lagged and tend to understate real earning power in the fast-growing suburban markets where the population has grown quickly and displaced the rural population. We capture what buyers declared on their actual mortgage applications. This is far more current than the American Community Survey Income figures collected on a sampling basis every 1-2 years, which are diluted by the nature of sampling across owner occupiers, part-time workers, and apartment dwellers. Instead, you get a picture of the incomes of people who are actually buying homes today in that location.
This matters enormously for market entry decisions. If you're evaluating a land position in an emerging market where there's limited sales history at higher price points, our income data can reveal that the buyers already financing homes in the area make significantly more than the census would suggest and therefore can support a higher price point than the local comp history implies.
3. The actual interest rates, not estimates. Interest rates aren’t publicly available from deed or listing data. Some third-party data providers make a rough estimate. We, in contrast, have access to the actual rate from the loan file. When you're trying to understand the competitive lending environment in a market, or benchmark what rate your competitor's buyers received versus yours, that distinction between "estimated" and "actual" is significant. Actual interest rate data also allow us to infer creditworthiness of the borrower pool across a region, to inform what loan incentive programs are needed to keep the loan package competitive.
4. Actual sold prices, even in non-disclosure states. If you're operating in Texas, Nevada, or any of the other states where sale prices aren't public records, you know the pain. New homes that sell directly from builder to buyer often never appear on deeds, and may not have gone through public listings either. We capture the sales price from the actual mortgages. Not automated valuations, not estimates, but the actual price. For financed sales, which are the vast majority of new home transactions, this is a reliable, ground-truth data point you can't get anywhere else.
5. Full buyer profile, by builder. We've linked the lending subsidiaries that belong to each builder: DHI Mortgage for DR Horton, etc. Now you can pull a chart showing applicant incomes organized by builders across a market, and see a direct comparison: who is your competitor selling to, what can those buyers afford, what loan products are they using, and how does that compare to your own buyer profile? This is the benchmarking use case; it's something that simply didn't exist before.
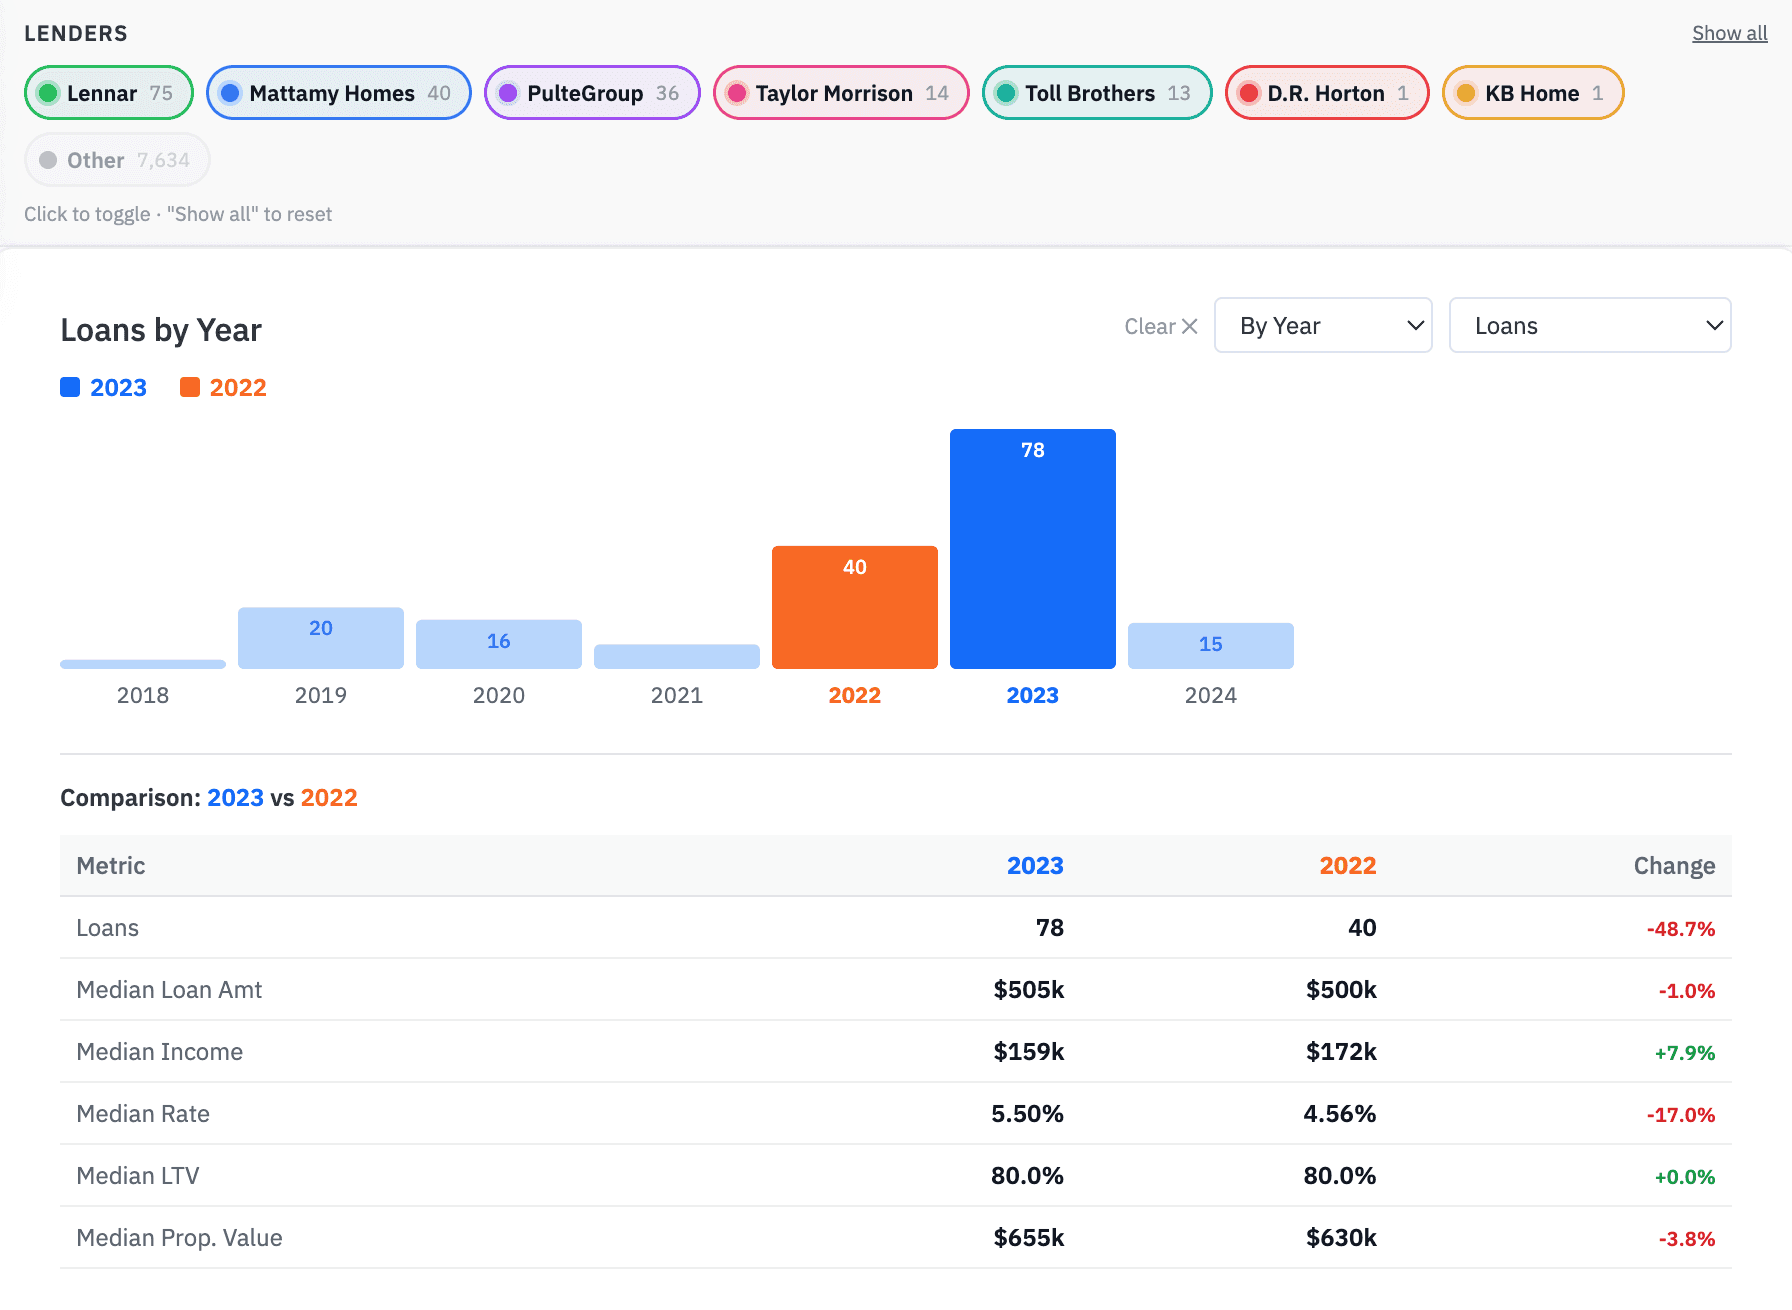
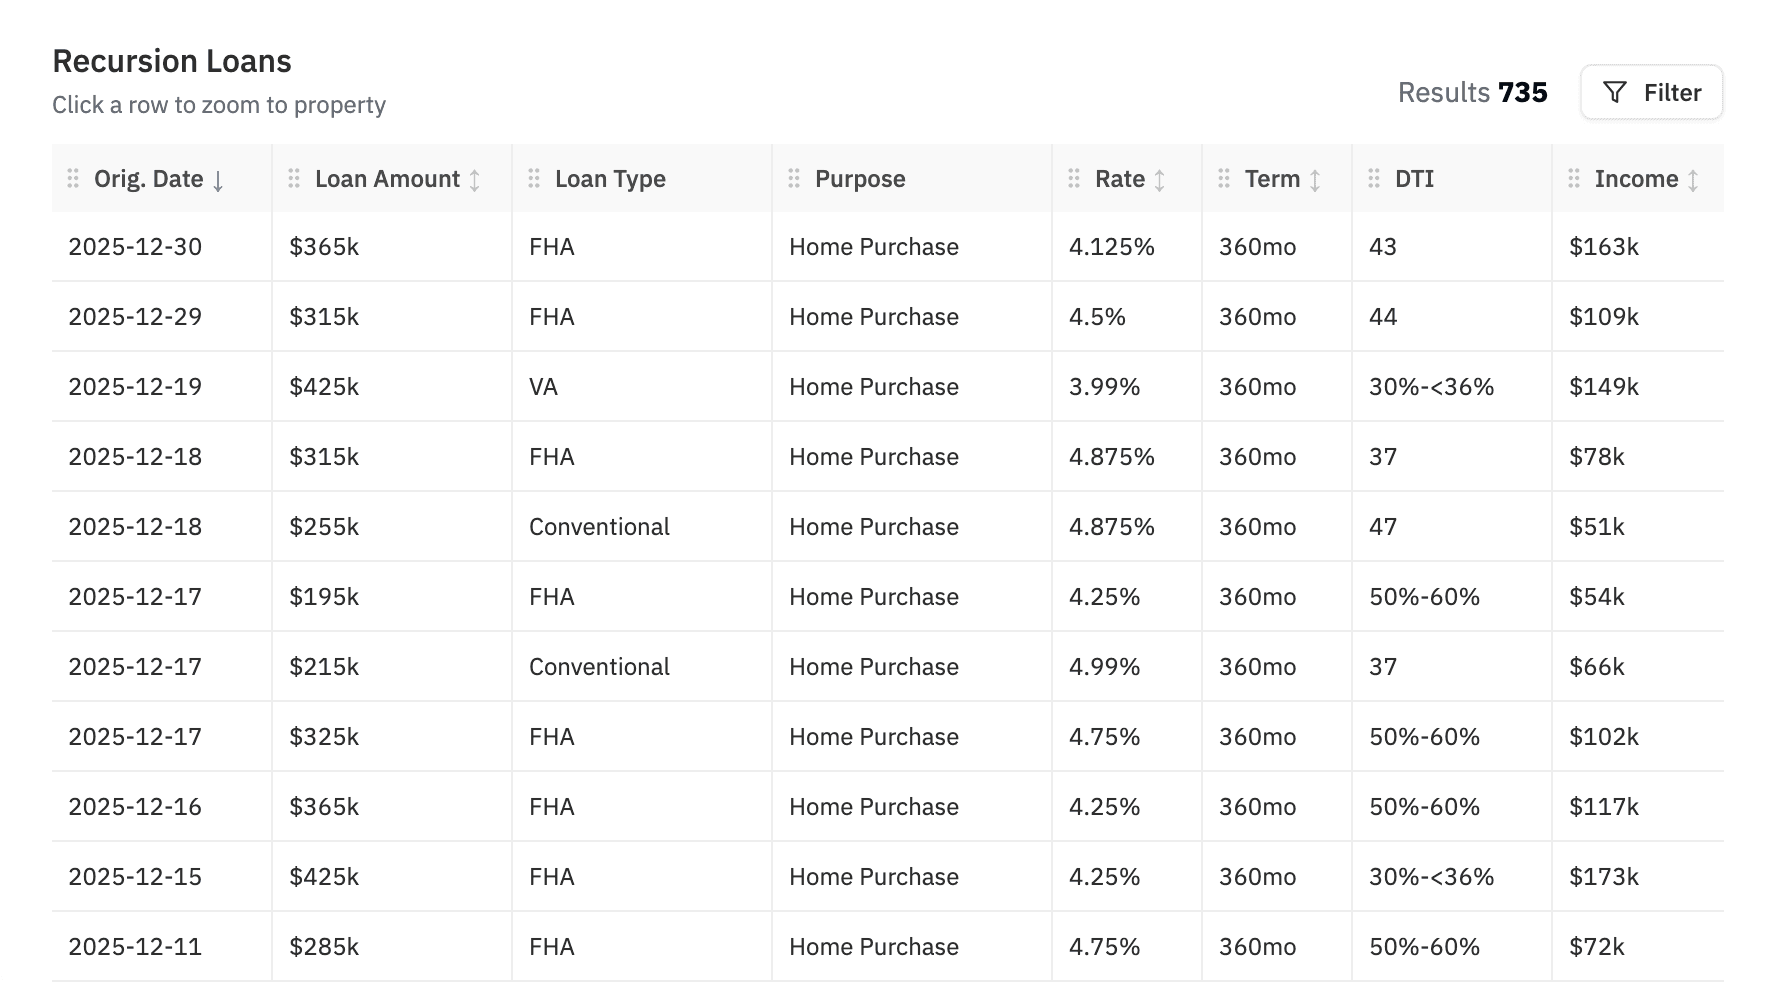
6. Sales velocity as a proxy. Loan origination dates are part of our record. When you aggregate them by community, you get a picture of sales velocity over time and see how quickly a competing community has been closing and whether that pace is accelerating or slowing. That's a great complement to the listing-based sales velocity data in the Locate Alpha’s community sales analytics module.
The Bottom Line
Homebuilders have always operated with incomplete information about competitors and markets. That's just the nature of the industry: data is fragmented, disclosure rules vary by state, and what's publicly available has historically been too anonymized to be actionable.
We break that open. It tells you what homes actually sold for, what buyers actually earn, what lending terms they actually received, and what incentives your competitors are actually running: at the property level, on a map, updated with data through early 2026.
Builders who use this will price better, enter markets with more confidence, and benchmark their competition with a clarity that wasn't possible before.
That's what we've built. We'd love to show you.
